As we hurtle towards Christmas, we are all wondering how the Holiday season will look like this year. All different types of businesses will be considering how Covid-19, and the ever-changing situation, will have an impact on them.
However, no two places are the same and the Covid-19 impact on local businesses will vary amongst different places. So, what are the criteria that affect an area the most?
This comes as a multifactor result that includes the type of people that live there, the jobs they have and how their everyday life has changed because of the pandemic.
That is why at Newgrove we have built detailed market spend estimates that have been modelled down to the local geographical level. This data is available to all our clients in Periscope and can help them understand who is spending what and where.
Christmas Spending 2021 VS Christmases of the past
It is interesting to look at the predictions on Christmas spending and see how they may compare with Christmases of the past.
Retail Week in collaboration with PwC produced a report in July making their predictions on what would be the key trends this Christmas. Together they predicted that we would spend more on the following product categories this Christmas in comparison with previous years:
- Clothing & Apparel
- Toys & Games
- Health & Beauty
These predictions reflect the belief that people will be more carefree with their spending than they were in Christmas 2020. The predicted rise in Clothing and Apparel and Health & Beauty reflects the desire to go out more whilst the increased spending on Toys & Games may be a response to the time spent indoors looking for entertainment opportunities.
In addition, a Forbes report predicts that consumer spending will be high this Christmas because of predicted tougher times ahead. Forbes believe people will spend now as result of anticipated challenges in the future caused by external factors such as:
- Supply chain challenges
- Staff shortages
- Increased cost of living
The importance of local demographic analysis
However, different groups of people in different places will react differently to all these pressures and trends and that is why local demographic analysis is so important.
 Periscope, the Google-maps based analytics tool from Newgrove, can help you understand what all this means to you and your business.
New consumer data is available combining spend estimates from the Office of National Statistics with local demographics. This has allowed us to make market spend data for every location available to all our clients and enables you to understand the locations that are most likely to be the winners and losers in the current economic environment.
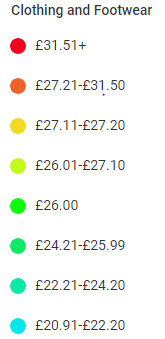
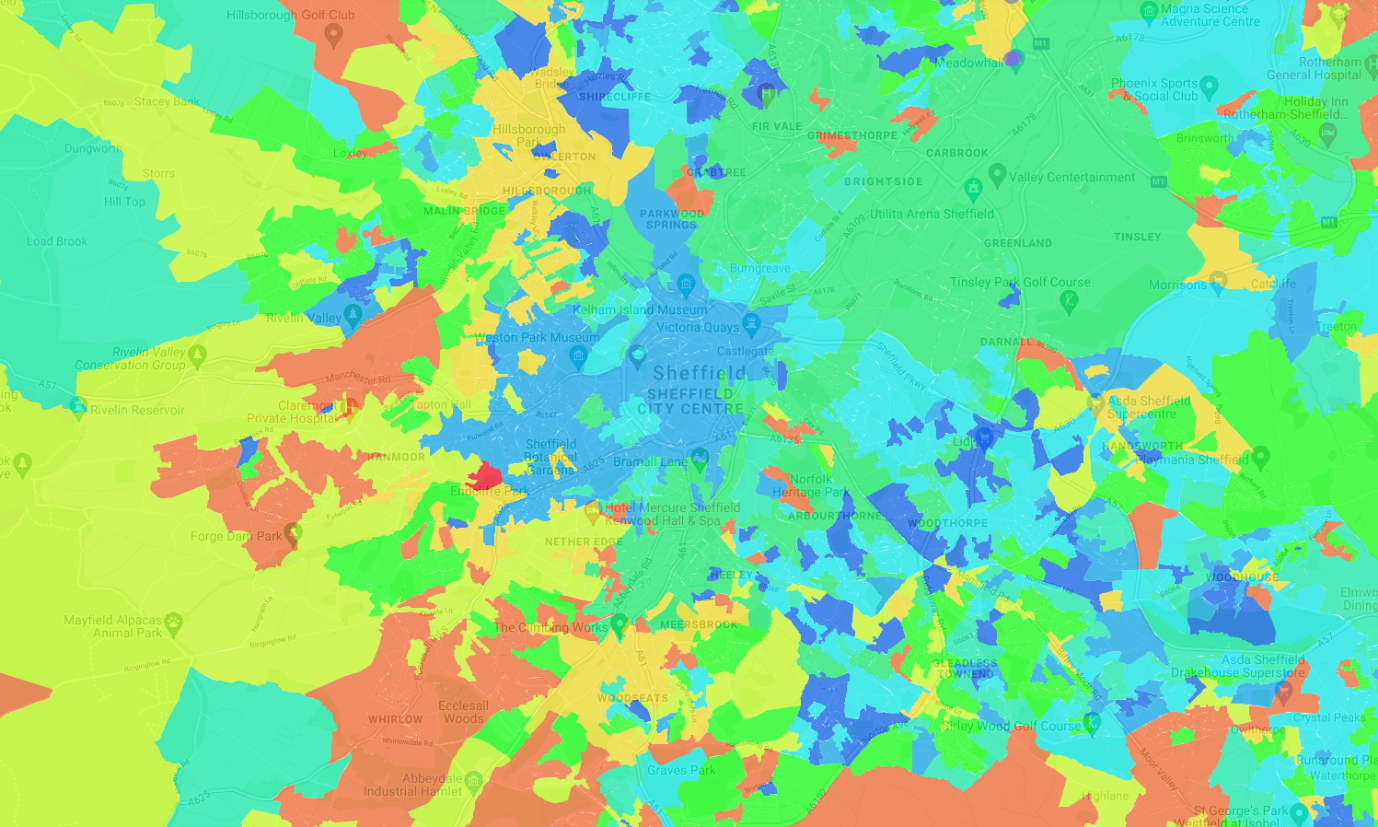
In the example shown above, we have produced a map of estimated weekly spend on clothing per household around Sheffield. The orange and red areas show those parts of Sheffield where people are likely to spend more on this category of goods whilst the green and blue areas are places where they are likely to spend less. This is important to know for both on-line and bricks & mortar retailers.
If you are ready to make the next step towards building a stronger and more competitive marketing strategy and you are interested in data like these, just get in touch. Our team of experts is always happy to walk you through everything with a free demo.

